Concept mapping is an evidence-based and a high-impact teaching strategy. But many teachers and students are unsure how to make a concept map easily. Discover how to make a concept map easily and with the help of an example.
A review of meta-analytic research shows that concept mapping has a typical impact of d=0.66. This is a much larger impact than most other teaching strategies. Therefore, it is essential that you know how to make a concept map!

But what does concept mapping involve and how can you use it?
This guide answers these and many other questions you may have.
As this a complete guide, it is quite long. If you want to go straight to a particular section, click on it in the following list of contents.
What Is Concept Mapping?
Concept mapping involves representing and organising interrelated knowledge visually and hierarchically. They are a specific type of graphic organiser.
Concept maps have 3 key parts. The first two parts are the:
- Concepts – usually written within rectangles or ovals
- Relationships between them – often represented by labelled arrows
Together, the concept-relationship-concept structure makes propositions. Propositions form the third key part of concept maps and they reflect the key understandings of the material.
Here is a simple example of a concept map about the states of matter. It shows the concepts within rectangles and the relationships with labelled arrows. The propositions or key understandings that it shows are:
- Matter has different states
- Solids are a type of state and states include solids
- Liquids are another type of state and states include liquids
- Gases are the third form of state and states include gases
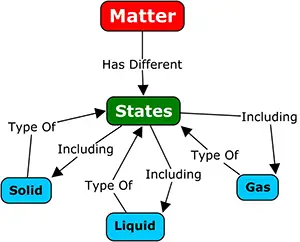
Note: Propositions don’t have to be grammatically correct. For example, solid → type of → state translates into solids are a type of state.
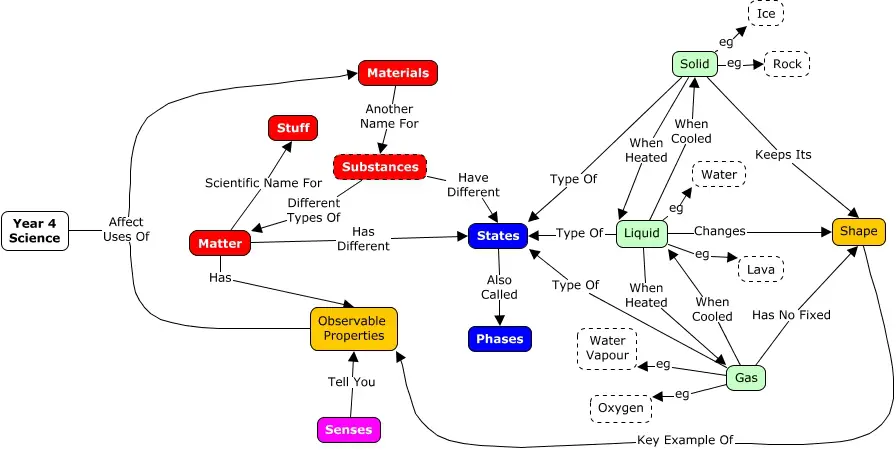
Here is a more developed example of a concept map of the concepts related to the states of matter.
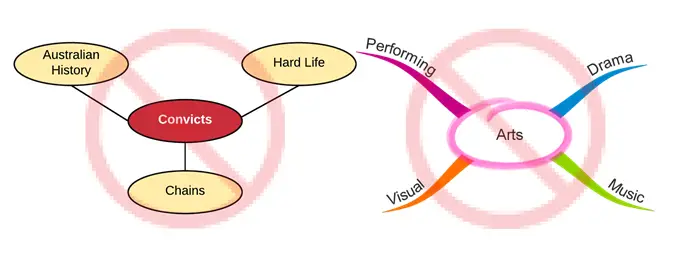
What Is NOT a Concept Map?
The next two diagrams are not concept maps. They do not explicitly show the relationships between concepts. Nor do they show a real hierarchy, as:
- Hard Life, Chains and Australian History
- Performing, Music, and Drama
should not be placed on the same hierarchical level.
Why Use Concept Mapping?
Your students’ minds do not store bits of information randomly. Rather, they store them in organised fashion using what psychologists call schema. These schema help students see how different pieces of information fit together. This includes how:
- New information fits with what students already know
- Various bits of new information fit together
Research1 shows that helping students integrate information into meaningful schema enhances learning.
Concept mapping offers you with a concrete way to do this. And, it has its own specific body of research which shows how powerful it can be.

Concept Mapping is Useful in Many Year Levels & in Many Subjects
One recent meta-analysis of research has shown that concept mapping has a positive impact on all levels of schooling. However, most studies focused on students in:
- Middle school
- Secondary school
The same research found that concept mapping is useful in both STEM and non-STEM subjects, as well as:
- English
- Science
- Humanities
However, there was a different review of research, finding that concept mapping wasn’t helpful in Mathematics. The study showing support for STEM subjects didn’t drill down further than classifying subjects as STEM vs non-STEM. And, as a different study found that using concept maps in Mathematics is not a good idea, I would proceed with caution in that area.
Two Ways to Make a Concept Map
There are two ways to make concept maps:
- By hand
- Using a computer (or iPad or similar)
You can create concept maps by hand. However, the process often involves moving concepts around, which can then require a lot of rubbing out. You’ll appreciate this more after you complete your first concept map. If you want your students to make a complex concept map by hand, then I suggest a bit of creative thinking. For example, you could use small Post-it® notes on a blank piece of A3 paper. You can use different coloured notes to help identify each hierarchical level. You connect the separate post-it notes with hand-drawn arrows and relationships. It may still involve some rubbing out, but not as much. Once you are happy with your map, you can copy it into a notebook.
You can also use software (or apps) to create concept maps. You can do this manually, using a generic graphics program such as Adobe Illustrator. However, it is easier to use a program specifically designed for concept mapping. Many schools already have a program called Inspiration. However, you can also download a free program called CMap from the Florida Institute for Machine & Human Cognition. It is the one I use. It comes in Computer, Server, iPad and Cloud versions.
For making your own concept maps, I recommend using CMap Tools (Windows, Mac, Linux), or otherwise CMap Tools for iPad,
How to Make a Concept Map Yourself a Simple Example
Before you start asking your students to make concept maps, it is a good idea to start making some concept maps yourself. It will help you:
- Understand what concept maps are good for, and what they are not
- To give better feedback and assistance to your students
Download & Install CMap Tools
Concept mapping can get a bit complex. So, I recommend using CMap Tools. It’s free! But you can donate at any time. Once you are familiar with the software, consider doing this.
- Click the above link
- Scroll to the bottom and click on the download button
It will open a new page - Scroll down until you see a form, enter your details in that form, and click submit
- Click on the download button for your operating system (e.g. mine was Windows 64-bit)
The file will download to your computer - Open or run the file. It’s an install file, not the program itself
The installation program has several steps. Most of them are self-explanatory
In step 3, choose Typical Installation
In step 4, choose your usual program file location. For Windows, this is simply C:\Program Files and the folder \IMHC CMap Tools
In step 5, choose some shortcut locations, such as Desktop & Start Bar - Review and confirm your options, and then you are all done
Making Concepts
In this section, you will learn how to create concepts and the linking relationships between them. This is the essence of concept mapping. You will also learn the necessary formatting skills you need to make more complex maps.
Start by opening CMap. Then click File and New. Maximise your CMap, so it fits a full screen.
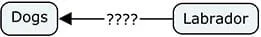
Double click anywhere on the page and a blank concept rectangle appears with ???? acting as a placeholder for your concept.
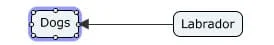
When the concept is selected, it has a blue rectangle around it and 2 arrows at the top. While your blank concept rectangle is selected, type the word dogs. You have made your first concept.

Now create a new concept for Labrador beside dogs.

Linking Relationships
It’s time to link these two concepts. When linking concepts, directions are important. In this case, I want to show that Labradors are a breed of dog. So I start from Labrador and draw a line to dogs.
- Select Labrador so that it has a blue line around it and two arrows at the top.
- Click on the two arrows, hold the mouse button down and drag across towards dogs
- When you get close to dogs, you will see a blue border around it and several anchor points
- Then, simply let go when you are over an anchor point
Once you let go, you will see ???? acting as a placeholder for your link label. Select ???? and then simply type your label, breed of.

You have now used the concept-link-concept format to create a proposition. If you have not left enough room between concepts to fit the words, breed of, select and drag one of the concepts, so they are further apart. You can also select and drag the words breed of to centre them again.
Propositions, concepts and the relationships (labelled arrows) between them are the basis of concept mapping.
How to Make a Basic Concept Map
There are steps you should consider when making a complete concept map. I expand on these concept mapping steps later in this guide, but they include:
- Identifying your focus
- Listing your key concepts
- Grouping your key concepts into hierarchical levels
- Linking your concepts
Focus
In this example of a basic map, I have chosen to focus on breeds of dogs that I have owned. Why? Partly because I love dogs, but mainly because it keeps the concept map nice and simple.
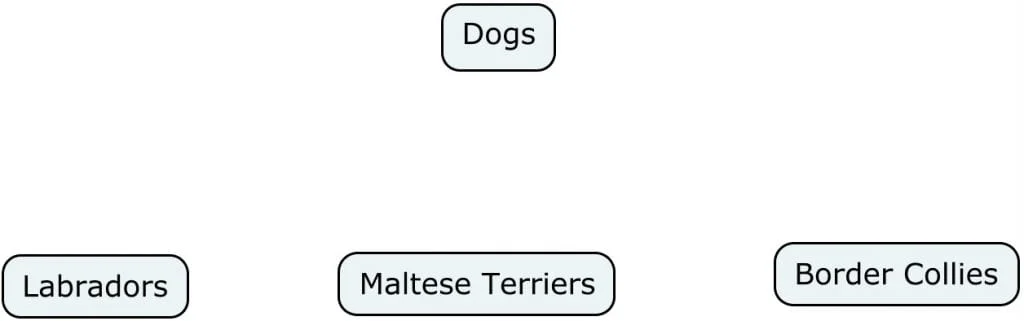
Listing Concepts
After deciding upon my focus, I simply list the relevant concepts.

Hierarchical Grouping
Next, you need to arrange your concepts into a basic hierarchy. Using the above concepts, Dogs would be at the top of the hierarchy, and the 3 breeds of dogs would be underneath. To move a concept, you simply click on it, hold the mouse button down and move your mouse.
I suggest that you also format each level of your hierarchy differently. To format an object, simply select it, then select the Format at the top of the screen. And, from the drop menu items, select Styles.
A small screen, such as the one below, will appear on your screen. Don’t worry if it looks different to mine. I will explain it.
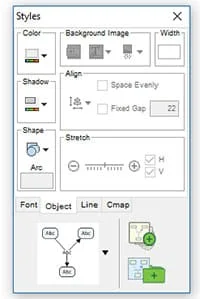
About ¾ of the way down the style screen, you will see 4 tabs – font, object, line and CMap. On mine, Object is selected. This allows me to format things such as shape (rectangle, rounded rectangle, circle), and the background colour. On yours, a different tab may be selected. Under the font tab, I can choose the font style, size and colour. Under the line tab, I can play around with arrows and line types.
With the style screen still open, select Dogs. It is the top concept in this map, so we want to make it stand out. I gave it a:
- Red background
- Bold, white, size 24 font
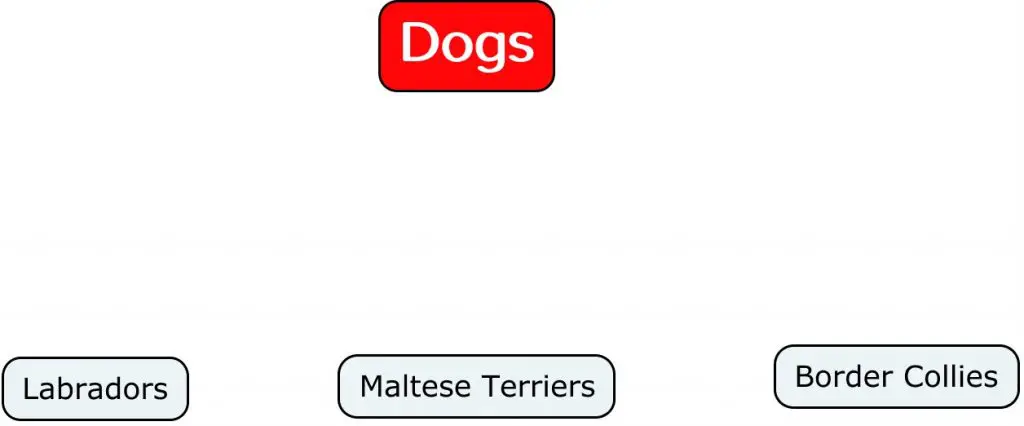
The concepts, Labrador, Maltese Terriers and Border Collies, are all on the same level of our hierarchy, so we want them to look the same. While they already do, I want to show you how to style multiple concepts at once.
- Click to the top left of Labradors
- Hold the mouse key down
- Drag to the bottom right of Border Collies
- Release
You simply click and drag around the objects you want to include. In this example:
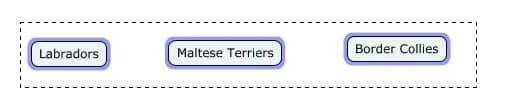
You can now go back to your Style screen (Format then Style), and style these 3 concepts all at once. I gave them a light orange background, and a black, size 16 font.

Linking Relationships
It is now time to create some linking relationships. Think about the direction of your relationship before making it. For example, I want to show that Labradors are a breed of dog. This relationship goes from Labradors to dogs, so I draw it that way. I repeated this process for Maltese Terriers and Border Collies.
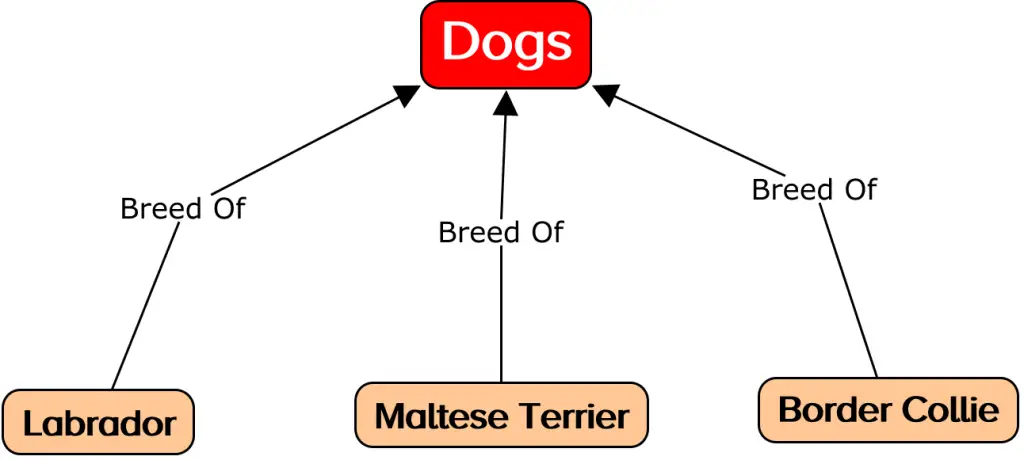
You now have a completed, albeit basic concept map. Next, we look in more detail at the steps involved in concept mapping.
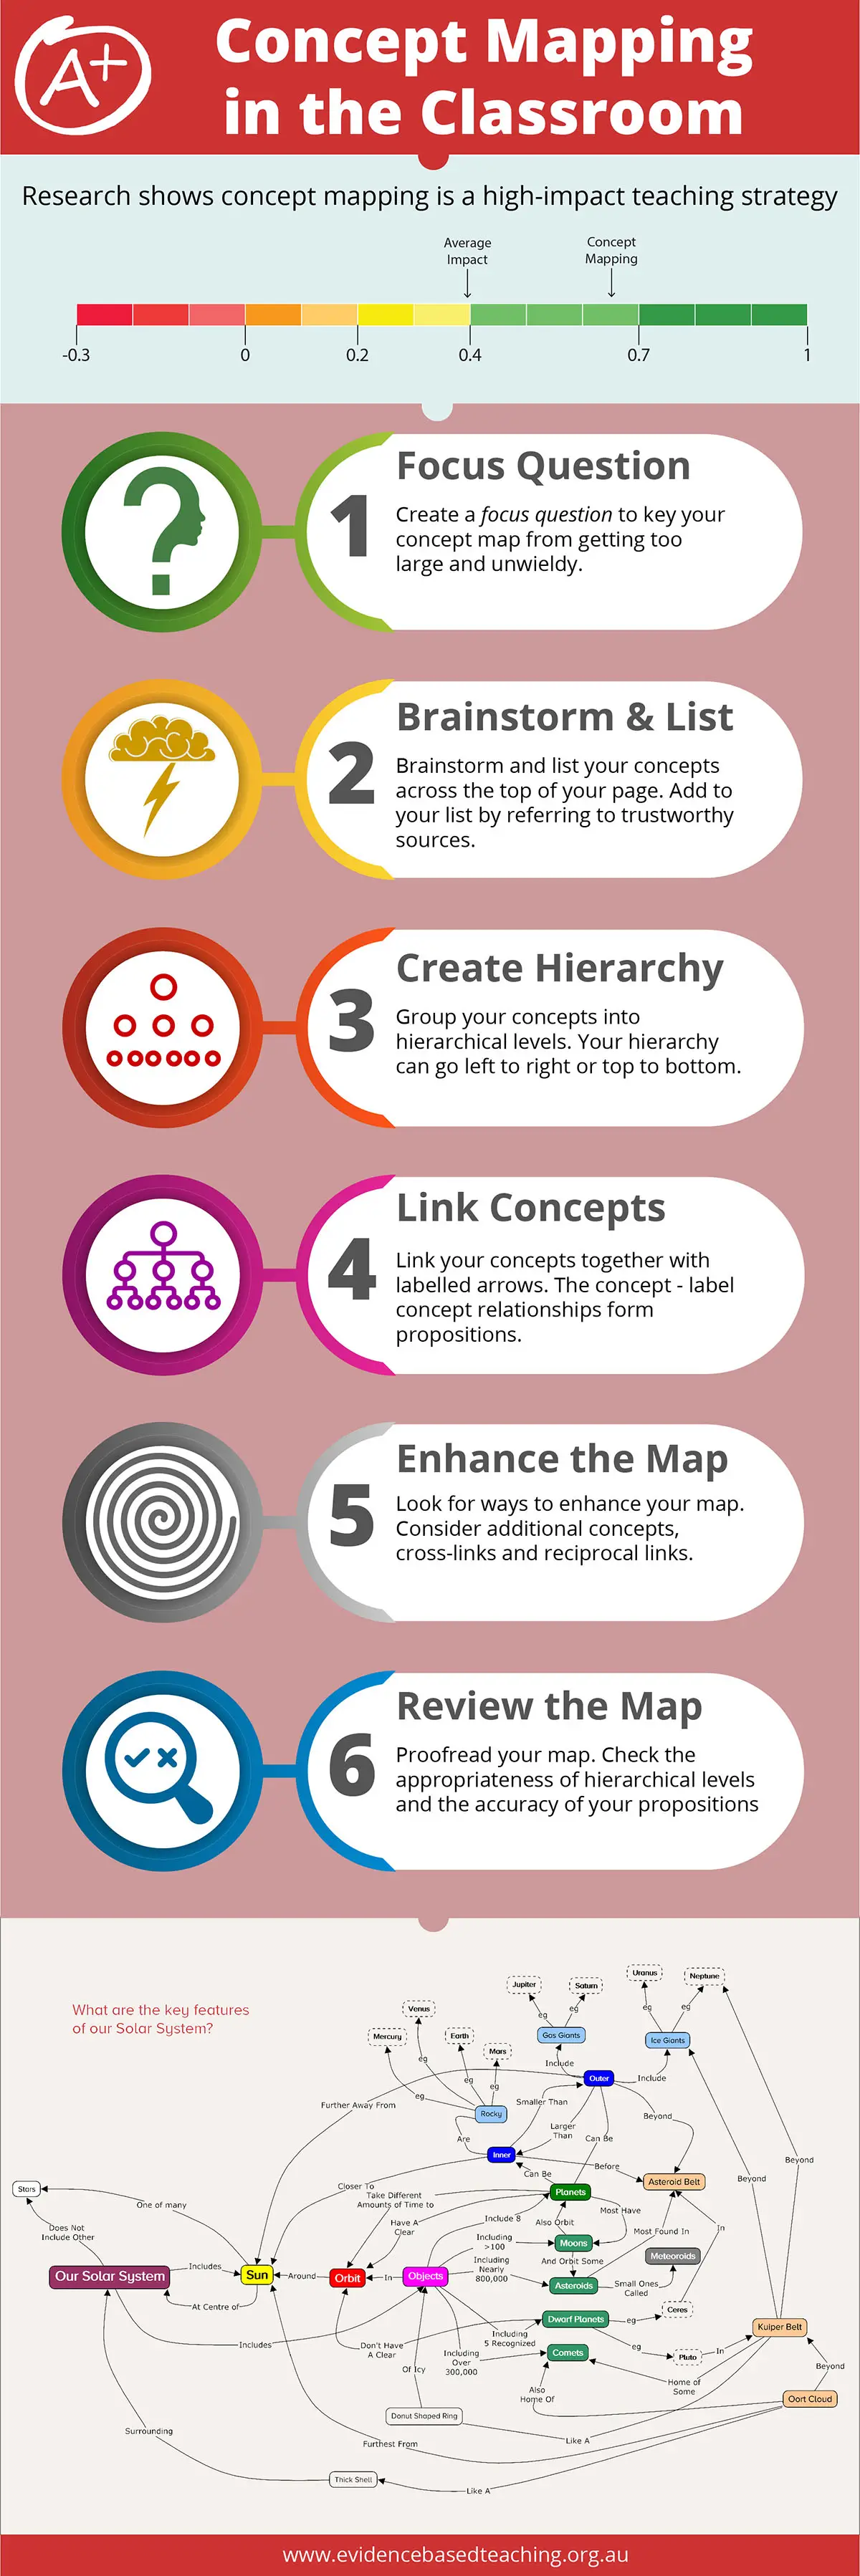
How to Make a Concept Map in 6 Easy Steps
There is no single set of steps to follow to make a concept map. However, the following steps give you a good starting point. You can go back and forth between the steps as needed.
Select a focus
It is common to use questions to focus your concept maps. For example, ‘What are the states of matter?’. You should save your blank concept map straight away. Then, as part of the saving process, you can specify your focus question.
Identify key concepts
You can identify key concepts by drawing on your existing knowledge. You can also refer to relevant written material, including textbooks (headings, subheadings, bolded vocabulary), trustworthy online websites and the online Australian Curriculum. In this step, you are just creating a list.
Levelling your concepts
You can use a top-down or a left-to-right You can also use different colours to help highlight the basic levels. You can also add different colours and font sizes for each level of your hierarchy.
Linking your concepts
Link your key concepts, making sure that each concept-relationship-concept in your map forms a proposition and that your propositions are factually correct.
Enhancing your map
Look for ways to enhance your map. Add in cross-links, examples and additional concepts. Things will come to mind, as the process of creating your map will get you thinking about your own understanding of the topic at hand. Note – as examples are not generalised concepts, make them look different in some way.
Review and publish
Review your work, including that it is factually correct as well proofreading spelling. Then it is time to publish!
A Step by Step Example
A Unit on The Solar System
Year 4 students learn about our solar system as part of their science curriculum. Involving them in concept mapping can enhance their learning. However, before I ask students to make concept maps, I make one myself. I normally do this as part of my unit planning process as it helps clarify the things students must understand. These steps describe the steps I took to create a concept map on the solar system.
Concept Mapping Step 1: The Focus Question
The topic of the concept map is the solar system. Yet, phrasing the topic as a question helps to focus the concept map, by avoiding unnecessary details. What should my focus question be?
To help answer that I had a look at the Australian Curriculum for Year 5 Science. I like to start at the end, that is what must the students be able to do. The achievement standard states that students should be able to describe the key features of the solar system.
So, I made my focus question:
What are the key features of the solar system?
Step 2: Identify & List Key Concepts
Brainstorming
With the focus question in mind, I brainstormed some key concepts that I believed would help answer my focus question. These included:
- Solar System
- Sun
- Planets
- Moons
Trustworthy Websites
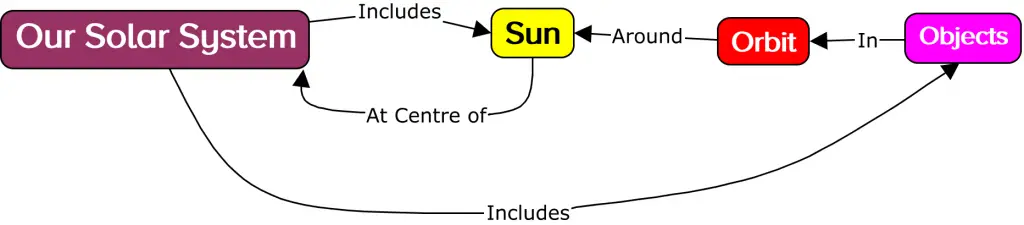
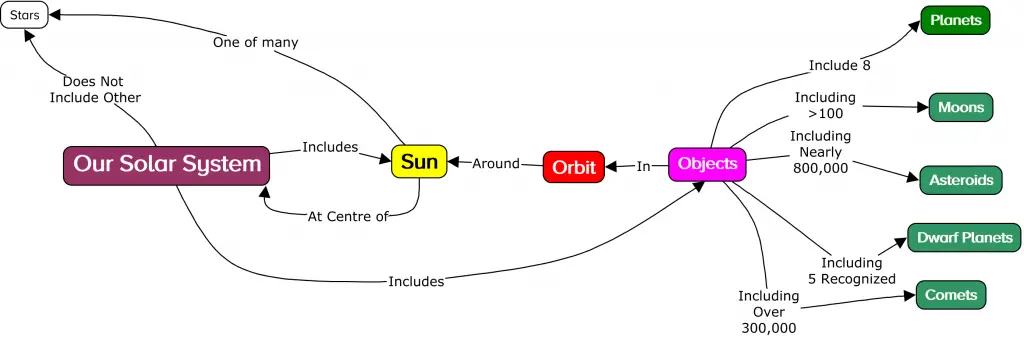
Then I looked up Solar System on NASA’s website. In a nutshell, it described our solar system as the Sun and the things that go around it. Things I had missed, included:
- Dwarf Planets
- Asteroids
- Comets
- Meteoroids
I also needed better words than things and go around. So I changed them:
- Things became objects
- Go around became orbit
Next, I went to a more in-depth overview of our solar system on NASA’s website. In addition to the above, they mentioned:
- Stars – specifically that our Sun is one of many stars
- Kuiper Belt
- Oort cloud
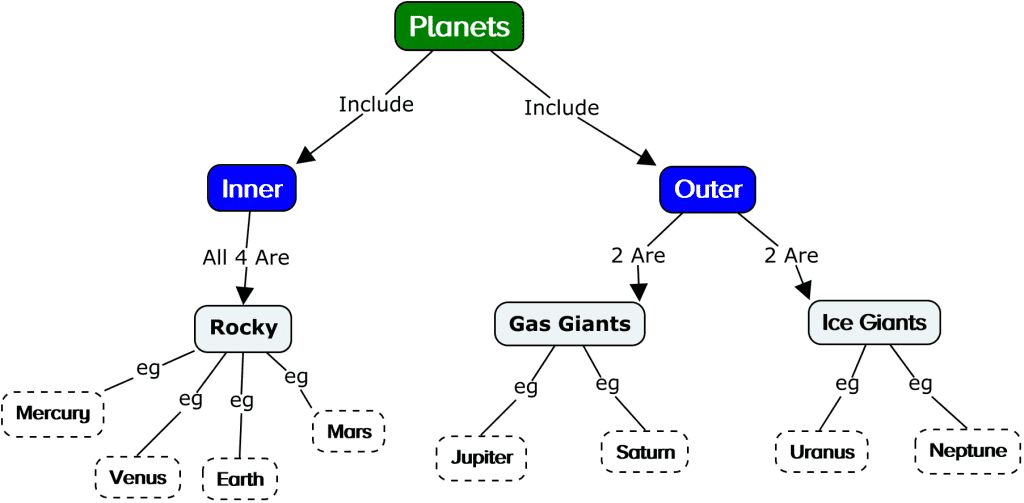
I then looked up NASA’s webpage on planets and found 3 types of planets, within 2 categories. The 2 categories were:
- Outer
- Inner
The 3 types of planets were:
- Rocky
- Gas Giants
- Ice Giants
Australian Curriculum
I then had a quick look at the relevant learning descriptor in the Australian Curriculum. It stated that the Earth is part of a system of planets orbiting around a star (the sun). Nothing to add from that.
Then I had a look at the elaborations and added the following concepts:
- Time (different planets take different amounts of time to orbit the Sun)
- Size (of the Sun and objects orbiting it)
- Distance (of planets from the Sun)
To finish this step, I listed my 21 concepts at the top of my concept map page.
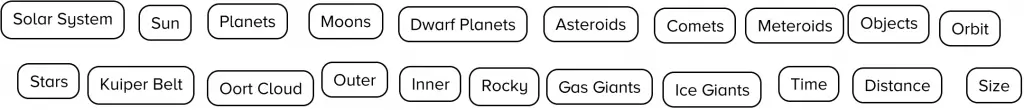
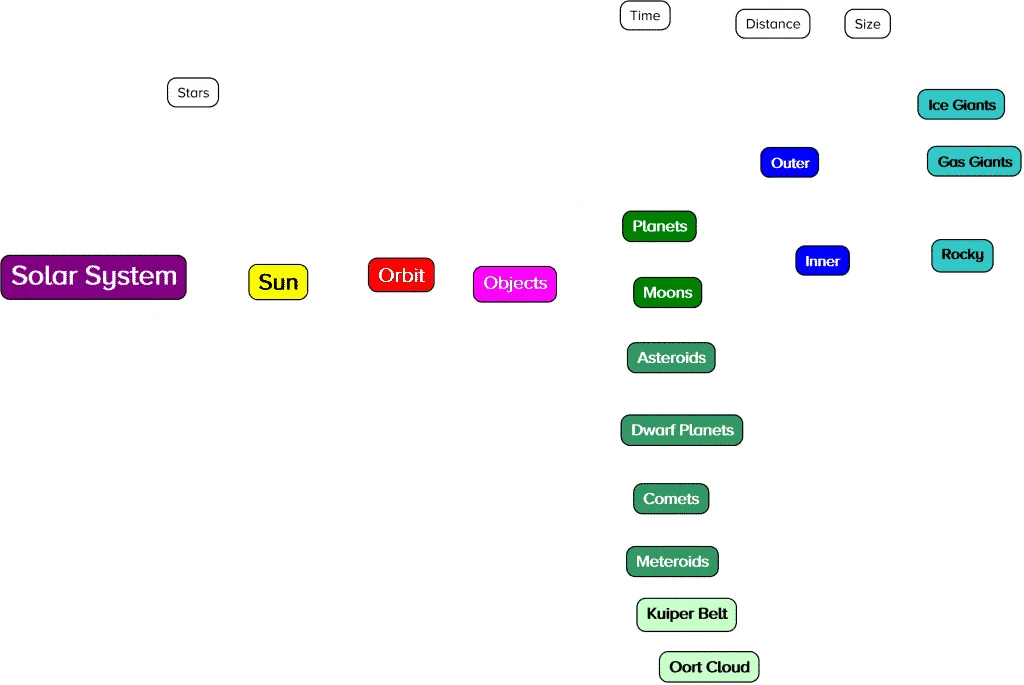
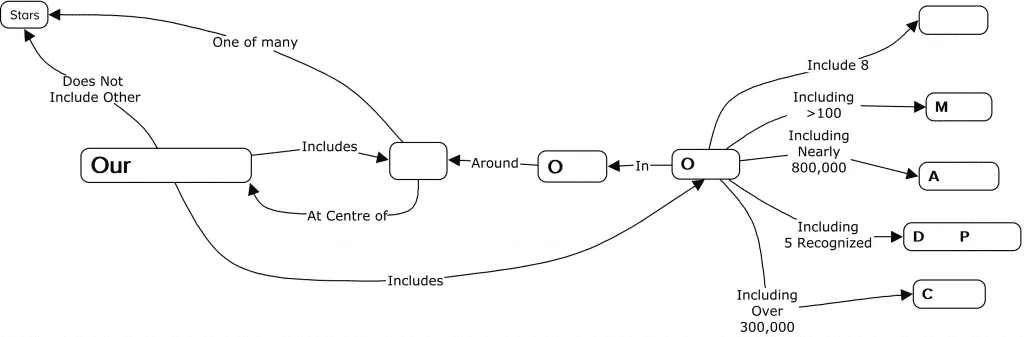
Step 3: Levelling Concepts
Next, I took the listed concepts and grouped them into a basic hierarchy. My hierarchy goes from left to right.
Essentially, I used colour and font size, as well as the physical location to show this hierarchy. Some concepts have different shades of the same colour, to show that while they technically at the same hierarchical level, some are more ‘key’ than others.
I also wanted the concept star to be close to the concept Sun. But as other stars are not part of our solar system, I left star as a plain white box with a small font size.
I still had not decided where to place the concepts, size, time and distance, so I left them unformatted at the top of the page to deal with later.
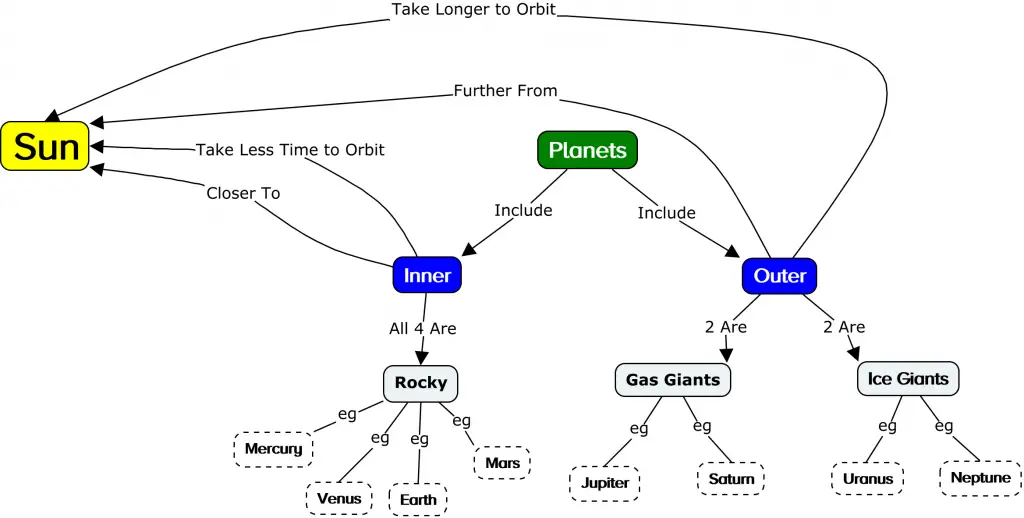
Concept Mapping Step 4: Linking Concepts
Step 4, when concept mapping, involves showing the key relationships between concepts in the above hierarchy. The shape of the map remains fairly like that shown in Step 3. However, as I had to add labelled arrowed lines, I moved some for aesthetic reasons.
I also decided to remove the concepts of size, distance and time. Instead, I referred to them in the labels of some of the arrowed lines. Here is what it looks like.

Step 5: Enhancing the Map
Next, I added in examples of some of the key concepts. These examples included all 8 planets, plus representative examples of some other concepts. I made my examples all look the same, black text in a white dotted rectangle.
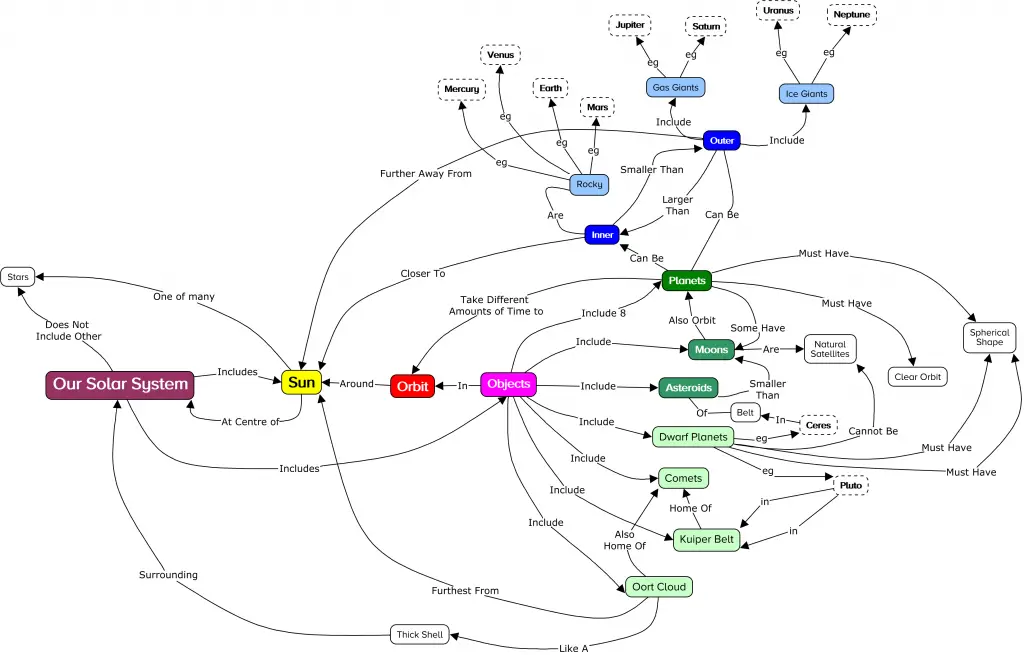
I also added some additional concepts, such as natural satellites, clear orbit, spherical shape, belt and thick shell.
Concept Mapping Step 6: Reviewing Your Concept Map
Overall, I was quite happy with my concept map. But I now needed to review it, proofread it and improve it.
Reviewing a complex map involves asking yourself questions, such as:
- How well does my map answer the focus question?
- Can my concept labels and link labels be more succinct?
- Are any concept labels listed more than once?
- Are my propositions factually correct?
- How accurate are my hierarchical levels?
After reflecting on these questions, and doing some further reading, I found 5 ways I could improve my map:
- The Kuiper Belt and Oort Cloud are not objects orbiting the Sun, but rather a collection of objects orbiting the Sun, so they would be better placed on a different hierarchical level
- The Kuiper Belt needed some further clarification
- Belt (asteroid) needed to be in the same hierarchical level as the Kuiper Belt and Oort Cloud
- The object meteoroid is a sub-class of asteroids
- The concepts orbit and clear orbit needed to be a single concept orbit with an appropriate link clear between planets and orbit
- Noticed, I had accidentally deleted meteoroids, so I added it back in
- Added some more details to some link labels
I also:

What Could You Get Out of this Form of Concept Mapping?
In addition to clarifying in my own mind what I was about to teach. This process allows me to generate propositions that I can use as part of my unit objectives.
See this example.
Concept Mapping Has More Impact on Student Learning in These 3 Situations
You can use concept mapping yourself to help you do things like getting your own head around a unit topic. This is what I did with the above concept map on the Key Features of Our Solar System. Research shows that such clarity has its own benefits, but concept mapping is only one way to achieve it. Furthermore, there is no research showing that using concept mapping in this way is any more effective than other ways of clarifying the focus and scope of intended learning. No research shows that concept mapping isn’t better either – there is just no research on the topic.
But research has shown that concept mapping has a more substantial impact on student learning when:
- Used to help students learn central ideas, rather than details
- Used within and beyond your classroom
- Your students actively engage with the map
Working with Central Ideas
If I was teaching this unit, I would not use the whole map with my students.
The concept map I made about our solar system was quite complex and detailed. Yet, research shows that concept mapping with school students works best when it focuses on central ideas rather than details.
I would start with the first 4 hierarchical levels.
I would then ask students to use their prior knowledge to come up with a list of what those objects include. Next, I would clarify and correct their ideas by including the fifth level of the hierarchy. When doing so, I would only show the key relationships between them.
When expanding on other concepts, such as planets or asteroids, I would make separate concept maps. I would do the same thing for additional concepts, such as the Kuiper Belt and the Oort Cloud. For example:
I would only show them in the overarching map, to explain key relationships – and then, only the relevant parts.
Done Within & Beyond Your Classroom
Essentially, this means that concept mapping has more impact on student results when students use it in class, and for:
- Homework
- Assignments
As with all homework and assignment work, you shouldn’t ask students to do something you haven’t shown them how to do in class.
Active Engagement
Active engagement involves thinking hard, and one of the best ways to get students thinking hard is through retrieval practice. This can take the form of:
- Fill in the blanks type maps
- Making their own maps
For example, in my first lesson on our solar system, after showing them the first 5 hierarchical levels of my own map, I may ask them to complete the following by themselves.
I would then ask them to do it for homework. I would repeat this task over time, each time asking them to do more of it themselves. Eventually, I would ask them to make the map from scratch.
It Doesn’t Matter …
The research shows that it doesn’t seem to matter:
- How long you use concept maps for (e.g. a 3-week unit, or a 10-week unit)
- If students complete concept maps individually or in small groups
- If students use static, animated or interactive concept maps
In Closing
I trust found this guide on concept mapping in the classroom helpful.
Please feel welcome to link to it from your website.
Infographic on Concept Mapping
Share this Image on Your Site
<p><strong>Please include attribution to https://www.evidencebasedteaching.org.au/ with this graphic.</strong><br /><br /><a href='https://www.evidencebasedteaching.org.au/concept-mapping-complete-guide/'><img src='https://www.evidencebasedteaching.org.au/wp-content/uploads/concept-mapping-infographic-web-final.jpg' alt='Concept Mapping in the Classroom' width='1200px' border='0' /></a></p>Footnotes
1 See for example: Rayner, Vanessa; Bernard, Robert; Osana, Helena (2013). A Meta-Analysis of Transfer of Learning in Mathematics with a Focus on Teaching Interventions. Conference Paper: American Educational Research Association; and, Donker, A. S.; de Boer, H.; Kostons, D.; Dignath van Ewijk, C. C.; van der Werf, M. P. C.(2014). Effectiveness of Learning Strategy Instruction on Academic Performance: A Meta-Analysis. Educational Research Review, 11, 1-26.
