Students learn best when you present information in multimodal ways. This is because we find it easier to learn through a combination of words and visuals. We call this the modality effect.

What Are Visuals?
A visual is simply a diagram or image that you create to get your point across. They come in many forms, and they may even include text. However, they are never text-based. Instead, visuals give you something to talk about, and they give students’ eyes something to focus on while they listen to you.
For example, when describing the differences between a solution and a suspension you would talk (words) about how the substance:
You could do this while displaying this diagram. You could easily draw this diagram on a blackboard, project it using PowerPoint or display it on an interactive whiteboard. In all cases, it is just a visual representation of the oral explanation that you give.


You could follow on with this visual while explaining that the second substance doesn’t stay spread out in a suspension. Rather, it spreads out when your shake or stir it, but it separates when left still.
The key is to use a combination of words and images at the same time.
Visuals Nurture Deep Learning
Deep learning involves students in making connections between different things. Visuals are an easy way to show students these connections. For example, you can easily use visuals to show:
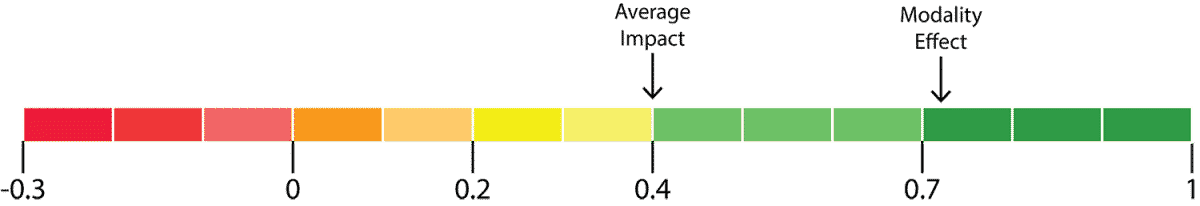
The Modality Effect
The modality effect comes from using visuals to support verbal explanations. Not from the visuals on their own. An Australian meta-analysis of the modality effect showed that it had an effect size of 0.72.
An Example of the Modality Effect in Action
I will show you what I mean by using a series of concepts contained in a short Year 7 history unit on the origins of humanity. In this unit, each inquiry question serves as the focus for 1-2 lessons. However, the teacher-led explanations, supported by visuals are only a part of each lesson.
Please feel free to use these visuals yourself.
Inquiry Question 1: What are historical theories?
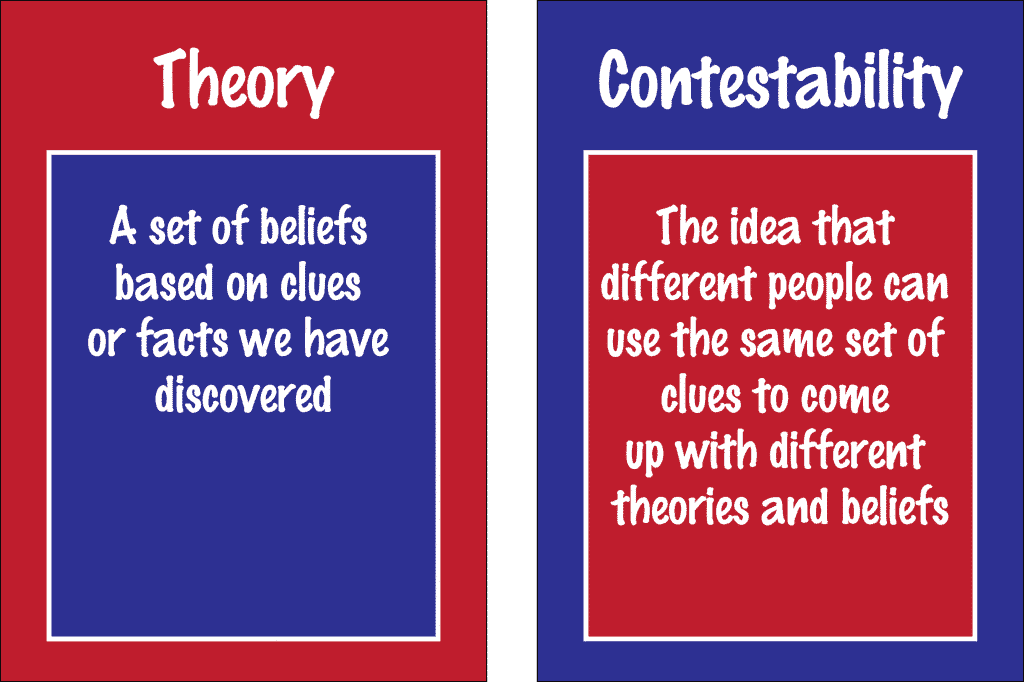
Theories are a core concept in history, as is the related concept of evidence. This short series of visuals introduces these concepts.
To begin the unit, I would explain that historians have beliefs about what happened in the past. They have reasons why they hold these beliefs, but the beliefs are different from facts. We call these beliefs historical theories. I could support my explanation by displaying and referring to Visual 1.
Visual 1

I would then explain that while theories are not always facts, they are more than just wild guesses. Historians take factual clues and think about them logically. They then come up with theories about what happened in the past based on the clues they have found. I would do all of this while displaying Visual 2. It shows how different things combine to create something else.
Modality Effect – Visual 2

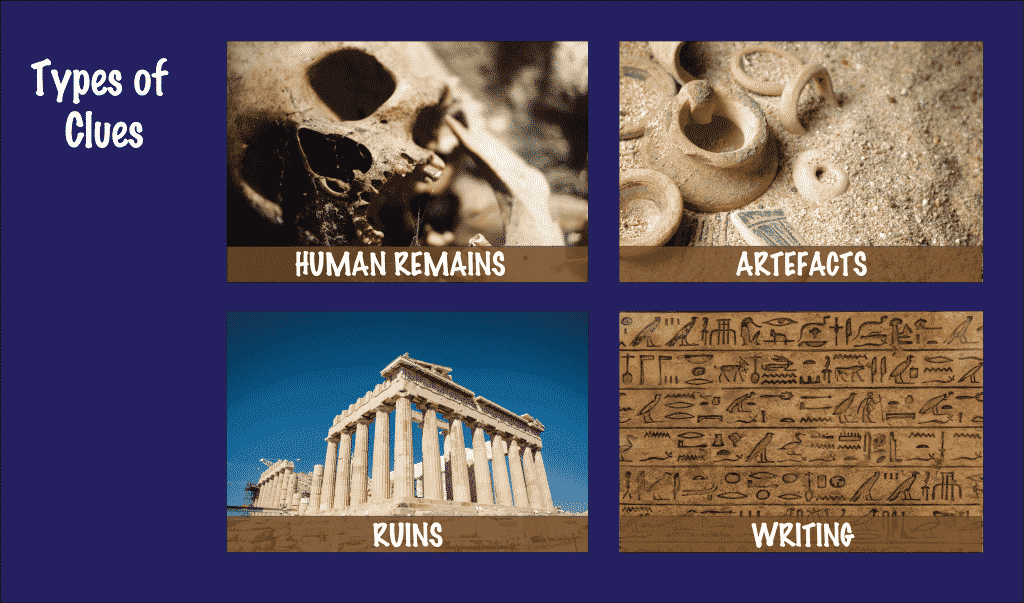
In the third part of my explanation, I would talk about how there are different types of clues and that historians call these clues evidence. My focus is the clues themselves. Yet, I would also explain that there is a variety of scientific techniques that can help us understand the clues we have found. These methods include:
Students do not need to understand the science behind these techniques. Instead, they need to know that they exist, and they help tell us more about the clues we have found. With that in mind, I would do this while displaying Visual 3. It focuses on types of clues rather than the scientific techniques used to analyse them.
Visual 3
These 3 simple visuals help students to have a deep understanding of historical theories and how they are developed. Furthermore, they allow me to succinctly explain some key concepts and to show how they connect with:
Inquiry Question 2: What is the Theory of Evolution?
The theory of evolution is not a core aspect of Year 7 history. However, a brief introduction
- Provides a foundation for the historical theory Out of Africa
- Allows you to introduce another key historical concept – contestability
At the core of the theory of evolution is the belief that living things change or ‘evolve’ over time to better adapt to their environment.
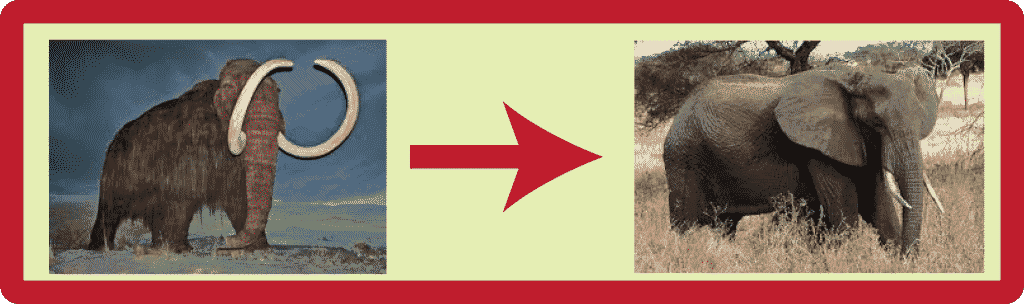
I would introduce this idea with Visual 4. It shows a woolly mammoth evolving into a modern elephant. The actual theory about how elephants evolved and their relationship to mammoths are more complex than this. But the point here is to illustrate adaptation over time.
Modality Effect – Visual 4
While still displaying the woolly mammoth visual, I would talk about other interesting adaptations. For instance, scientists believe that:
- Some lizards lost their legs so that they could burrow better in the sand
- Horses evolved from fox-sized woodland animals. As forests gave way to grasslands, and predators grew faster, horses evolved to grass-eating, quick animals.
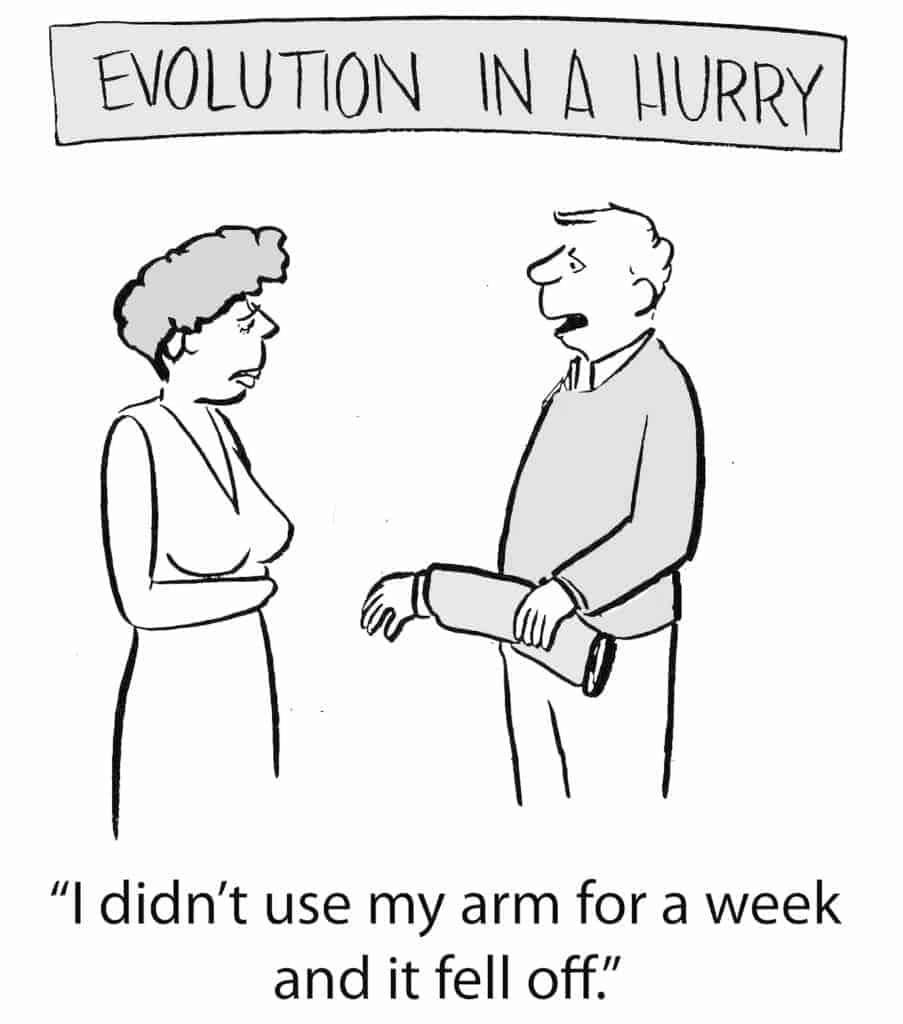
I would emphasise the idea that we adapt over long periods of time with a little humour and Visual 5.
Visual 5
At this point, I would refer back to the idea that theories are a set of beliefs based on factual clues, but that theories are not the same as facts. Then, I’d introduce the idea of contestability with Visual 6. Contestability is the idea that different people can use the same set of clues to come up with different theories.
Modality Effect – Visual 6
I would then explain that while most scientists and historians believe the theory of evolution is correct, there are people who do not. There are some people who believe that:
Inquiry Question 3: How did humans evolve?
I would introduce human evolution by referring to the commonly held belief that humans evolved from monkeys. I would show my students Visual 7 while doing so.
Visual 7

I would then move to what, from a historical perspective, is the main idea of this lesson. Humans did not evolve directly from apes. Instead, apes and human-like creatures evolved from a common ancestor. This common ancestor had a mixture of ape and human features. These human-like creatures were called hominids. Today, humans are the only hominids still alive. However, in the past, there have been many other hominids. I would explain this while showing visual 8.
Modality Effect – Visual 8
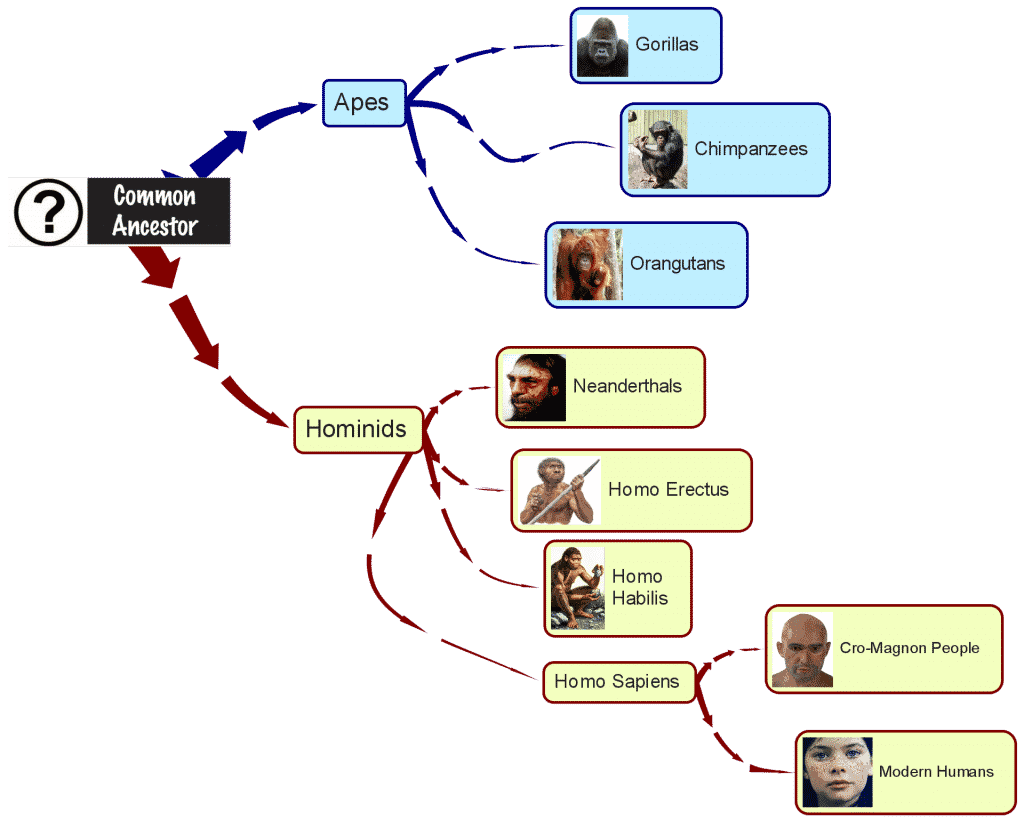
The hierarchical visual above shows you that:
You can revisit the idea of contestability, by highlighting that scientists:
For instance, some scientists will include Neanderthals as a type of Homo sapien, rather than being its own species. Other scientists include chimpanzees as hominids.
Visual 8 is handy in differentiating between:
However, it doesn’t offer much insight into when each type of hominid lived or when they died out. I would explain that some lived:
I would refer to Visual 9 while explaining this.
Visual 9

Students should now have a deeper understanding of the origins of humanity. Specifically, they should now know that:
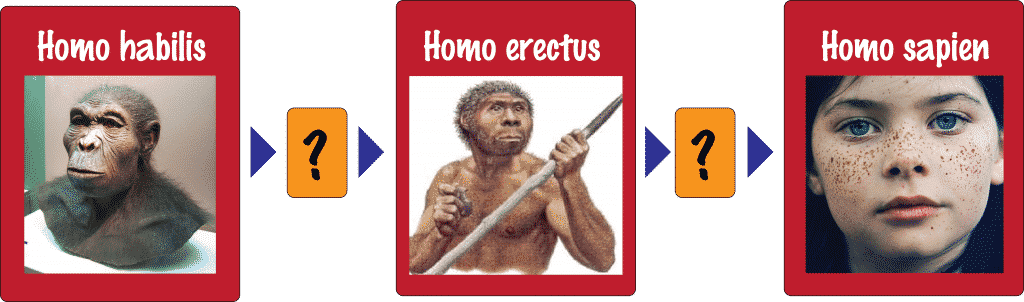
However, students still don’t know who evolved from who. You could use Visual 10 to show this. In simple terms, we evolved from Homo erectus, who in turn evolved from Homo habilis. The question marks show that:
Modality Effect – Visual 10
Inquiry Question 4: What is the Out of Africa Theory?
I would explain that the Out of Africa theory is a belief that all humans (Homo sapiens) evolved in eastern Africa. Then, some of them decided to venture out of Africa and settled in various parts of the world. I would display Visual 11 while explaining this.
Visual 11
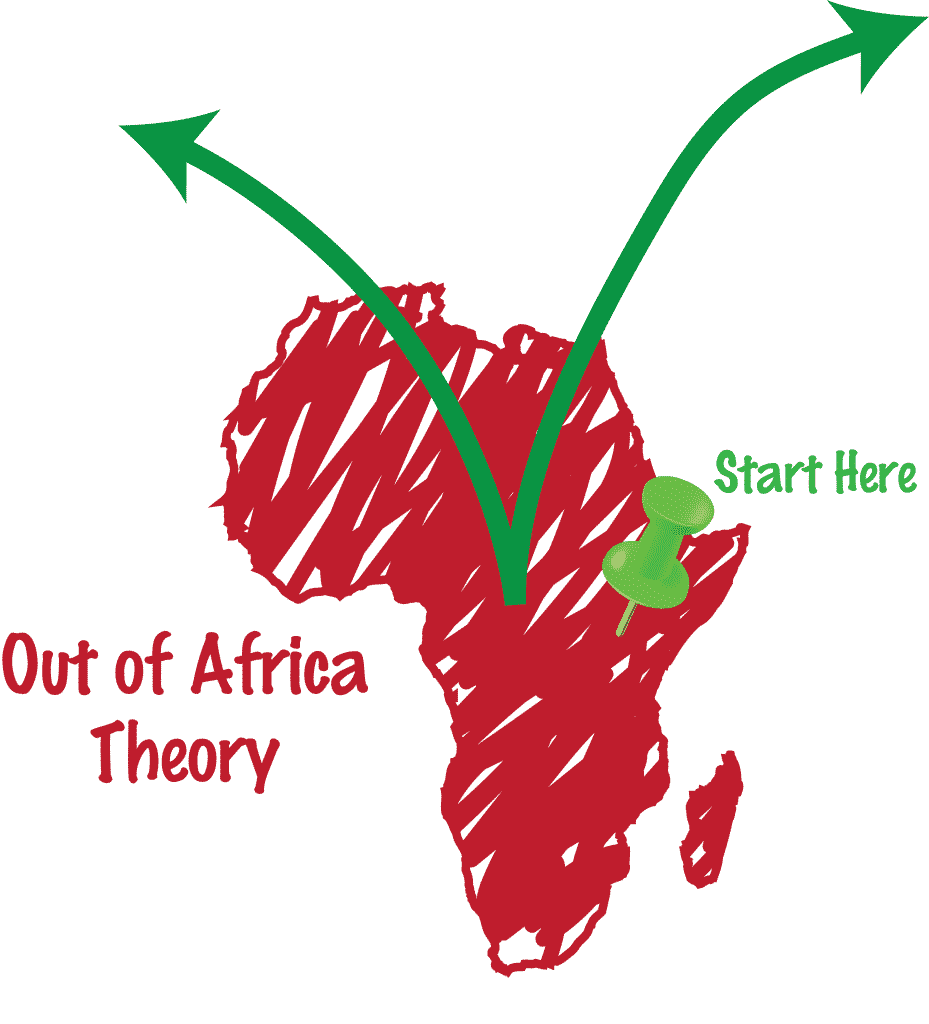
While still displaying this same visual, I would also mention that Homo sapiens were not the only hominids to venture out of Africa. Both the Neanderthals and Homo erectus left Africa before we did.
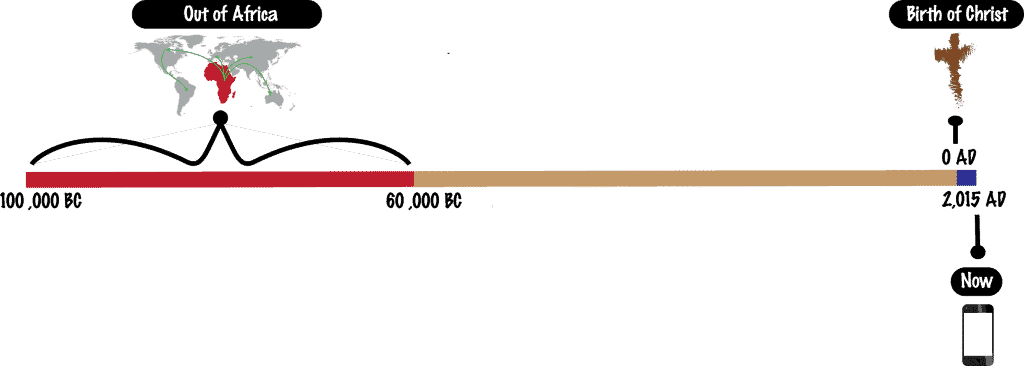
Next, I would explain that this happened a long, long time ago (100-60 thousand years ago). I would then emphasise this point graphically with Visual 12.
Modality Effect – Visual 12
I would finish by returning to the idea of contestability. Most scientists and historians believe in the Out of Africa theory. Yet, some of them disagree on the dates, on the paths taken and on the number of times hominids left Africa.
Then, there are others who disagree entirely and who propose an alternative theory. In this alternative theory, Homo erectus left Africa and settled in different parts of the world. Humans then evolved from Homo erectus, not just in Africa, but in all the corners of the globe.
I would show Visual 13 while discussing this contestability and the alternative theory.
Modality Effect – Visual 13

Using Visuals & the Modality Effect In A Nutshell
Using visuals to complement your verbal explanations enhances your students’ learning. This is known as the modality effect.
Using visuals in this way also helps to nurture deep learning. They do this by clarifying the connections between different things.
Using visuals to achieve the modality effect is a high-impact teaching strategy. Check out other high-impact strategies here.
